englelab::get_template(score_script = TRUE)6 Single Merged File
Data Scoring
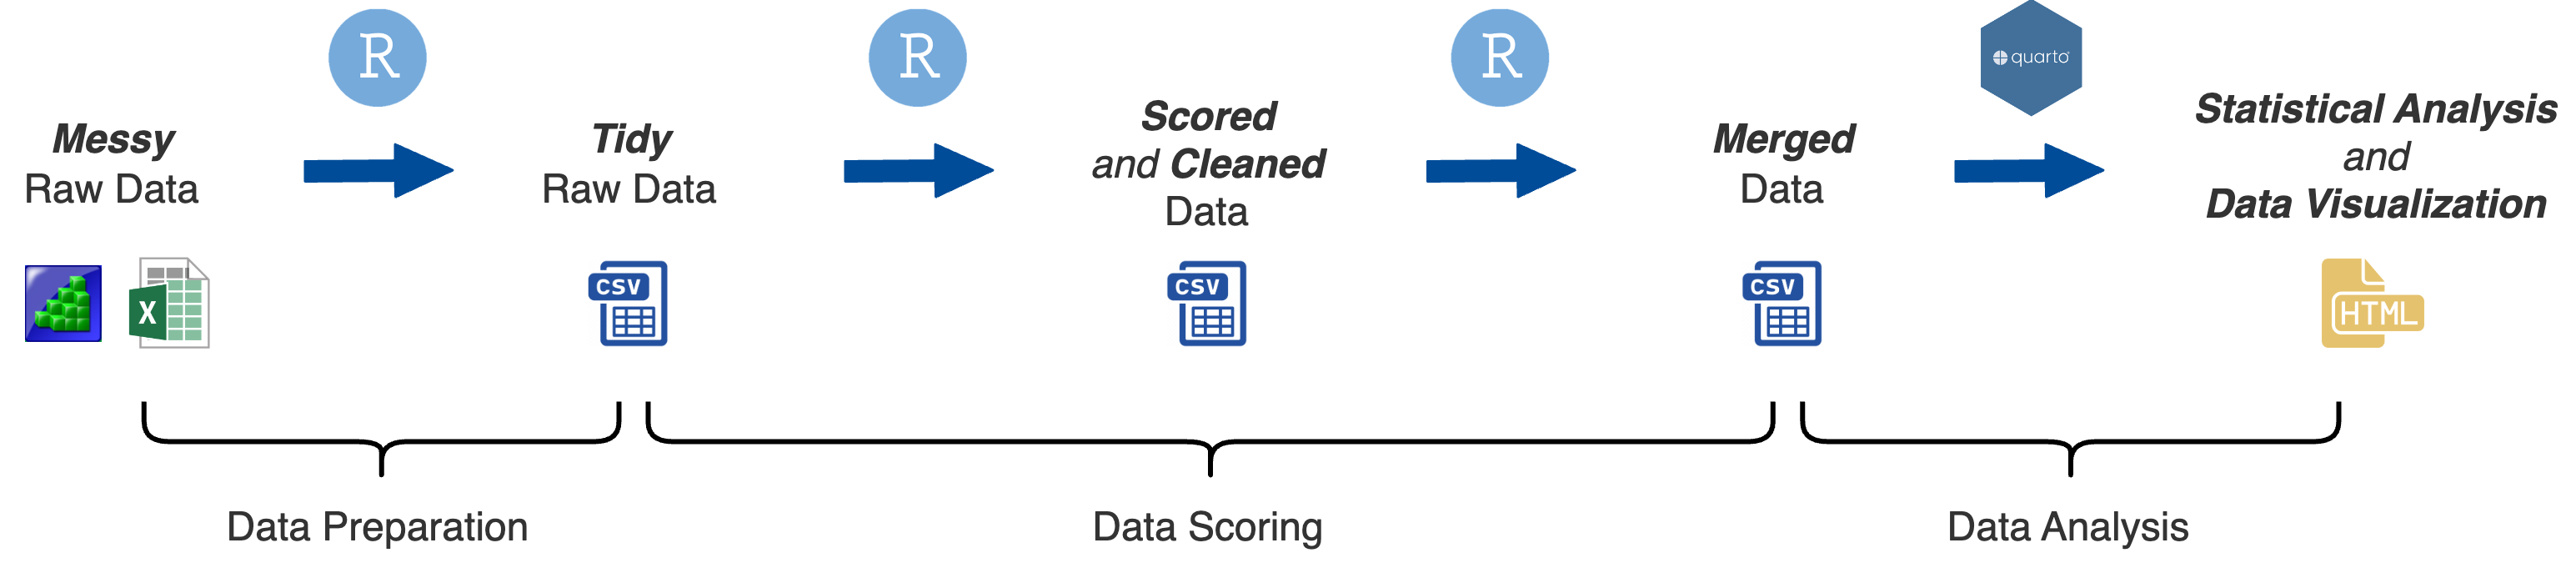
At this stage of data processing you have created multiple data files containing the task scores, reliabilities, and other variables for each task. The next step is to create a single merged data file containing the primary task scores for each task that you will be performing data analysis on. We can also create data files with the reliabilities, administration times, and a log of the data cleaning steps.
You can download an R script template to score tidy raw data files:
Setup
# ---- Setup ------------------
# packages
library(here)
library(readr)
library(dplyr)
library(purrr)
library(tidyr)

# directories
import_dir <- "data/scored"
output_dir <- "data"

# file names
output_scores <- "TaskScores.csv"
output_reliabilities <- "Reliabilities.csv"
output_admintimes <- "AdminTimes.csv"
output_datacleaning <- "DataCleaning_log.csv"
# -----------------------------
Import
To import and merge multiple data frames we can use purrr::map() |> purrr:reduce()
# ---- Import Data ------------
files <- list.files(here(import_dir), pattern = "Scores", full.names = TRUE)
data_import <- files |>
  map(read_csv) |>
  reduce(full_join, by = "Subject")
# -----------------------------
Task Scores
At this step, you may also want to filter out subjects that have missing data on specific tasks, or too much missing data across all the tasks.
I advise creating a final subject list of all subjects that made it to this state of data processing.
Reliabilities
# ---- Reliabilities ----------
data_reliabilities <- data_import |>
  select(contains("splithalf"), contains("cronbach_alpha")) |>
  drop_na() |>
  distinct() |>
  pivot_longer(everything(),
               names_to = c("Task", "metric"),
               names_pattern = "(\\w+.\\w+).(\\w+)",
               values_to = "value") |>
  pivot_wider(id_col = Task,
              names_from = metric,
              values_from = value)
# -----------------------------
The code in pivot_longer(names_pattern = "(\\w+.\\w+).(\\w+)") follows a specific naming scheme used for column names. Underscores (optional) can be used for task names and column descriptions, but a period (required) is ONLY used to separate the task name / description from the description of the task score type / what the value represents (e.g., RT = reaction time, splithalf = split-half reliability)
Task_Name_MoreStuff.ScoreType
e.g., StroopDL_Last4Rev.ResponseDeadline, VAorient_S.k, Antisaccade.ACC
This should also be used for reliabilities and admin times:
e.g., StroopDL_Last4Rev.splithalf, StroopDL.AdminTime
Admin Times
# ---- Admin Times ------------
data_merge <- data_import |>
  select(contains("AdminTime")) |>
  summarise_all(list(mean = mean, sd = sd), na.rm = TRUE) |>
  pivot_longer(everything(),
               names_to = c("Task", "metric"),
               names_pattern = "(\\w+.\\w+).(\\w+)",
               values_to = "value") |>
  mutate(value = round(value, 3)) |>
  pivot_wider(id_col = Task,
              names_from = metric,
              names_prefix = "AdminTime.",
              values_from = "value")
# -----------------------------
Data Cleaning Log
There will be two sets of cleaning logs we need to import
- Problematic subjects
- Outliers
# ---- Data Cleaning Log ------
# problematic subjects
data_problematic <- list.files(here("data/logs"),
                                 pattern = "problematic",
                                 full.names = TRUE) %>%
  map(read_csv) |>
  map(function(x) {
    reframe(x, tibble(Task = gsub("\\..*", "", colnames(select(x, 2))),
                       Problematic_Removed = nrow(x)))
  }) |>
  bind_rows()

# outliers
data_outliers <- list.files(here("data/logs"),
                                 pattern = "outliers",
                                 full.names = TRUE) %>%
  map(read_csv) |>
  map(function(x) {
    reframe(x, tibble(Task = gsub("\\..*", "", colnames(select(x, 2))),
                      Outliers_Removed = nrow(x),
                      Outliers_Passes = max(pull(x, Pass))))
  }) |>
  bind_rows()

# merge
data_log <- merge(data_problematic, data_outliers, by = "Task", all = TRUE)
# -----------------------------
Save Data
# ---- Save Data --------------
write_csv(data_scores, here(output_dir, output_scores))
write_csv(data_reliabilities, here(output_dir, output_reliabilities))
write_csv(data_reliabilities, here(output_dir, output_admintimes))
write_csv(data_log, here(output_dir, output_datacleaning))
write_csv(subjlist, here(output_dir, "subjlist_final.csv"))
# -----------------------------

rm(list = ls())