englelab::get_template(raw_script = TRUE)2 Tidy Raw Data
Data Preparation
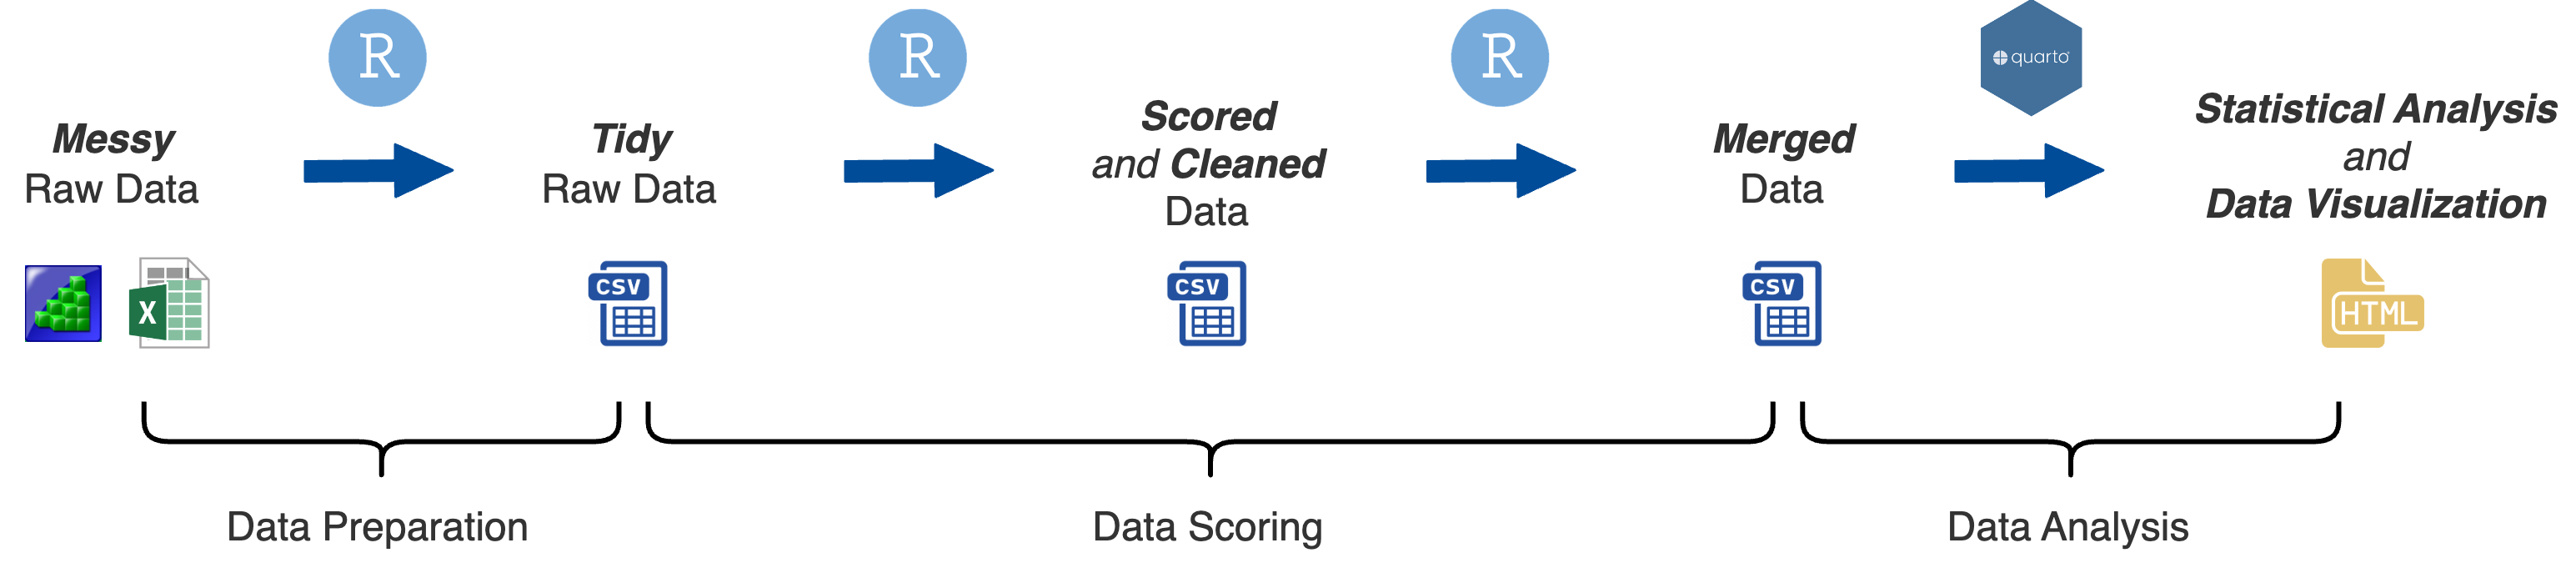
At this stage of data processing you have compiled the raw data files. The next step is to convert the messy raw data files into tidy raw data files.
Overview of Template
You can download an R script template to convert messy raw data files into tidy raw data files:
Setup
# ---- Setup ------------------
# packages
library(here)
library(readr)
library(dplyr)
library(purrr) # delete if not importing a batch of files

# directories
import_dir <- "data/raw/messy"
output_dir <- "data/raw"

# file names
task <- "taskname"
import_file <- paste(task, ".txt", sep = "")
output_file <- paste(task, "raw.csv", sep = "_")
# -----------------------------
The Setup section is to:
Load any packages used in the script
Set the directories of where to import and output data files to
Set the file names of the data files to be imported and outputted
I like to include the directory and file names at the top of the script that way it is easy to see what is being imported/outputted and from where right at the top of the script rather than having to search through the script for this information.
We can then use the import_dir , output_dir, import_file, and output_file variables in the script when we import and output a data file.
Import
Two different import options are included in the script:
-
Import a single file: You can use the standard import functions from
readrto do this -
Import multiple files and merge them: To do this, you need to use
purrr::map_df()with areadrimport function
# ---- Import Data ------------
# to import a single file
data_import <- read_delim(here(import_dir, import_file), delim = "\t",
                          escape_double = FALSE, trim_ws = TRUE)

# alternatively to import a batch of files...
# change the arguments in purrr::map_df() depending on type of data files
# this example is for files created from eprime and needs encoding = "UCS-2LE"
files <- list.files(here(import_dir, task),
                    pattern = ".txt", full.names = TRUE)
data_import <- files |>
  map_df(~ read_delim(.x, locale = locale(encoding = "UCS-2LE"),
                      delim = "\t", escape_double = FALSE,
                      trim_ws = TRUE, na = "NULL"))
# -----------------------------
Tidy Data
This is the meat of the script, where the action happens. It will also be different for every task, obviously. I will cover common steps in more detail below.
Save Data
No need to change anything here. Isn’t that nice?
Understand the Messy Raw Data
You should take some time to better understand your messy raw data file:
Use functions, such as colnames() and unique() to explore your imported data file.
- Identify the essential columns you want to keep. Some examples:
- Unique IDs for each participant
- If there are multiple trials or items adminstered, what column identifies the trial or item number?
- Same thing if there were multiple blocks or sessions adminstered
- Different experimental conditions or counterbalancing condition
- Stimulus information (e.g., red square) for individual trials / items
- Response information
- Response made
- Correct response (if there is one)
- Accuracy (if there is one)
- Response time
- Adminstration date and time?
- And more…
- What kind of values do each of those columns contain?
- Numeric? Character strings?
The amount of time it will take for you to do those steps is the reason we are doing this data preparation step. The end product will hopefully be a tidy raw data file that is way easier to understand and work with, even for someone that was not involved in the project.
How you need to tidy up your data file will depend on the nature of your program used to generate your data. However, there are some common messy problems we can address.
Column names that are not clear:
rename()Rows that are not needed:
filter()Add or modify values in columns:
mutate()andcase_when()Columns that are not needed:
select()
Notice in the script template I laid out the general format for this.
Messy Data Example
Let’s use a hypothetical data set to see how to do these steps
colnames(data_import)[1] "ID" "trial" "COND" "Proc Trial" "slide1.resp"
[6] "slide2.resp" "Ans" "slide1.rt" "slide2.rt" Rename Columns
This step can actually be completed in the rest of the steps below but occasionally can be useful to do upfront, especially if the column names contains special characters.
One thing you might want to do at this point is consider a standard naming scheme for your columns and variables across your study. Do you want to use capital letters? All lower case? Snake_case? CamelCase? A combination of those? etc.
data_raw <- data_import |>
  rename(TrialProc = `Proc Trial`)
Important
- You need to use the special type of quotation marks
` `if your column names contain special charaters like: a space,$,%,-, and more…
View the Data Frame tab to see the resulting data frame
Use the small arrow ▸ at the end of the column names to see more columns
Filter Rows
One of the first things that is useful to do is get rid of rows in the messy data file that you don’t need.
You need to figure out the value names that correspond to the rows you want to keep.
unique(data_raw$TrialProc)[1] "inst" "prc" "tsk" Let’s say we only want to keep rows that have a value of prc or tsk
Add and Modify Columns
This is where most of the work will be done for data preparation. Some common problems with messy raw data files:
- The same information is contained across different columns BUT in different rows
- Values in columns don’t make sense and/or require understanding how the program was setup
- Missing columns that should be there
Combine information across columns
You can probably guess that the data contained in slide1.resp and slide2.resp contains the same information about what response was made. But one is for practice trials and the other for real trials. This should just be combined in one column. Same thing with slide1.rt and slide2.rt.
There is a convenient function to do this, dplyr::coalesce()
View the Data Frames tab to see the resulting data frames
Use the small arrow ▸ at the end of the column names to see more columns
Values in columns don’t make sense
Some common examples
The
trialnumber continues across practicepracticeandrealtrialsConditionhas values of 0 and 1. What do 0 and 1 mean???TrialProchas values that can be more clearValues in columns
ResponseandAnsdo not make sense. What do 1, 2, and 3 mean???
data_raw <- data_import |>
  rename(TrialProc = `Proc Trial`) |>
filter(TrialProc == "prc" | TrialProc == "tsk") |>
mutate(Response = coalesce(slide1.resp, slide2.resp),
RT = coalesce(slide1.rt, slide2.rt),
Condition = case_when(COND == 0 ~ "congruent",
COND == 1 ~ "incongruent"),
TrialProc = case_when(TrialProc == "prc" ~ "practice",
TrialProc == "tsk" ~ "real"),
Response = case_when(Response == 1 ~ "red",
Response == 2 ~ "green",
Response == 3 ~ "blue"),
Correct_Response = case_when(Ans == 1 ~ "red",
Ans == 2 ~ "green",
Ans == 3 ~ "blue")) |>
mutate(.by = c(ID, TrialProc),
Trial = row_number())View the Data Frame tab to see the resulting data frame
Use the small arrow ▸ at the end of the column names to see more columns
Add additional columns
You may have noticed that there is no column corresponding to accuracy. We have Response and Correct_Response information so we can create a new column for Accuracy
data_raw <- data_import |>
  rename(TrialProc = `Proc Trial`) |>
  filter(TrialProc == "prc" | TrialProc == "tsk") |>
  mutate(Response = coalesce(slide1.resp, slide2.resp),
         RT = coalesce(slide1.rt, slide2.rt),
         Condition = case_when(COND == 0 ~ "congruent",
                               COND == 1 ~ "incongruent"),
         TrialProc = case_when(TrialProc == "prc" ~ "practice",
                               TrialProc == "tsk" ~ "real"),
         Response = case_when(Response == 1 ~ "red",
                              Response == 2 ~ "green",
                              Response == 3 ~ "blue"),
         Correct_Response = case_when(Ans == 1 ~ "red",
                                      Ans == 2 ~ "green",
                                      Ans == 3 ~ "blue"),
         Accuracy = case_when(Response == Correct_Response ~ 1,
                              Response != Correct_Response ~ 0)) |>
mutate(.by = c(ID, TrialProc),
         Trial = row_number())
View the Data Frame tab to see the resulting data frames
Use the small arrow ▸ at the end of the column names to see more columns
Remove Columns
Finally, we can remove and reorder columns using select():
data_raw <- data_import |>
  rename(TrialProc = `Proc Trial`) |>
  filter(TrialProc == "prc" | TrialProc == "tsk") |>
  mutate(Response = coalesce(slide1.resp, slide2.resp),
         RT = coalesce(slide1.rt, slide2.rt),
         Condition = case_when(COND == 0 ~ "congruent",
                               COND == 1 ~ "incongruent"),
         TrialProc = case_when(TrialProc == "prc" ~ "practice",
                               TrialProc == "tsk" ~ "real"),
         Response = case_when(Response == 1 ~ "red",
                              Response == 2 ~ "green",
                              Response == 3 ~ "blue"),
         Correct_Response = case_when(Ans == 1 ~ "red",
                                      Ans == 2 ~ "green",
                                      Ans == 3 ~ "blue"),
         Accuracy = case_when(Response == Correct_Response ~ 1,
                              Response != Correct_Response ~ 0)) |>
  mutate(.by = c(ID, TrialProc),
         Trial = row_number()) |>
  select(ID, TrialProc, Trial, Condition, Response,
         Correct_Response, Accuracy, RT)
We now end up with a tidy raw data frame!
You can see that this data frame is much easier to understand and to work with. Someone outside of your project would have a decent understanding of what information is contained and what is being measured.